 Figure 8.6.3
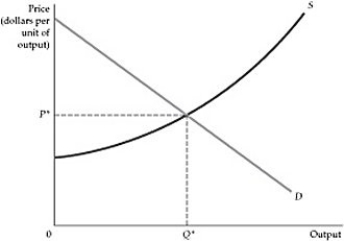
-Refer to Figure 8.6.3 above. Producer surplus in the figure equals the area:
A) below market price and above the supply curve.
B) below market demand and above market price.
C) between market supply and market demand, from zero to the equilibrium quantity.
D) below the supply curve, from zero to the equilibrium quantity.
Correct Answer:
Verified
Q89: Use the following statements to answer this
Q90: Q91: Q92: Ronny's Pizza House operates in the perfectly Q93: The shutdown decision can be restated in Q95: Short-run supply curves for perfectly competitive firms Q96: Homer's Boat Manufacturing cost function is: Unlock this Answer For Free Now! View this answer and more for free by performing one of the following actions Scan the QR code to install the App and get 2 free unlocks Unlock quizzes for free by uploading documents![]()
![]()

