 Figure 5.2.1
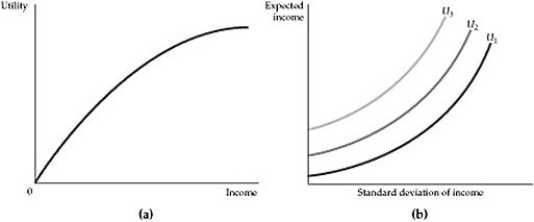
-Refer to Figure 5.2.1 above. Because risk is undesirable, the greater the amount of risk, the greater the expected income needed to make the individual equally well off. Which of the two graphs best describes this assertion?
A) The figure in panel (a)
B) The figure in panel (b)
C) Both figures
D) Neither figure
Correct Answer:
Verified
Q54: Tom Wilson is the operations manager for
Q55: Scenario 5.5:
Engineers at Jalopy Automotive have discovered
Q56: Calculate the expected value of the following
Q57: The concept of a risk premium applies
Q58: Scenario 5.5:
Engineers at Jalopy Automotive have discovered
Q60: John Smith is considering the purchase of
Q61: Scenario 5.6:
Consider the information in the table
Q62: The individual pictured in Figure 5.2.2:
A) prefers
Q63: Consider the following information about job opportunities
Q64: Scenario 5.6:
Consider the information in the table
Unlock this Answer For Free Now!
View this answer and more for free by performing one of the following actions

Scan the QR code to install the App and get 2 free unlocks

Unlock quizzes for free by uploading documents