 Figure 4.1.3
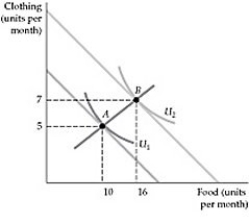
-Refer to Figure 4.1.3 above. From the information on the figure we can derive:
A) a price-consumption curve.
B) two points on an individual demand curve.
C) a shifting demand curve.
D) an upward-sloping demand curve.
Correct Answer:
Verified
Q3: An Engel curve shows combinations of:
A) income
Q4: Q5: Which of the following is true regarding Q6: In the diagram below, Marvin's optimal consumption Q7: If an increase in the price of Q9: Which of the following is true regarding Q10: The income-consumption curve Q11: Which of the following goods is an Q12: Q13: Unlock this Answer For Free Now! View this answer and more for free by performing one of the following actions Scan the QR code to install the App and get 2 free unlocks Unlock quizzes for free by uploading documents![]()
A) illustrates the combinations of![]()
![]()

