 Figure 4.6.1
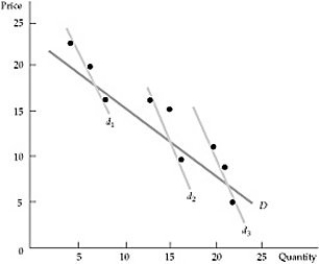
-Refer to Figure 4.6.1 above. The demand curves d1, d2 and d3 are:
A) an example of demand curves poorly estimated.
B) demand curves that represent the change in variables other than price, such as income.
C) demand curves for three different types of goods, which are then used to construct an aggregate demand curve.
D) demand curves that depict the change in market price as time goes by.
Correct Answer:
Verified
Q105: When Post cereals, the producer of Grape
Q106: Software companies continually work to develop new
Q107: Other things being equal, the lower the
Q108: In the demand equation log(Q) = a
Q109: The analysis of utility maximization is carried
Q111: In recent years, the specification and estimation
Q112: Coupons and rebates are examples of:
A) market
Q113: The advantage of an isoelastic demand curve
Q114: The marginal utility associated with the additional
Q115: Part of the reason for the success
Unlock this Answer For Free Now!
View this answer and more for free by performing one of the following actions

Scan the QR code to install the App and get 2 free unlocks

Unlock quizzes for free by uploading documents