 Figure 2.3.1
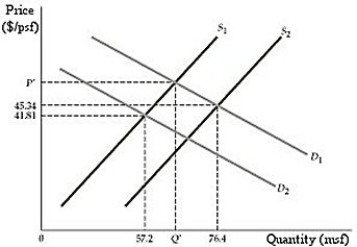
-Refer to Figure 2.3.1. In Example 2.4, the textbook describes the impact of 9/11 on the real estate market in New York city. How does the sketch in figure 2.3.1 adapt to the described scenario?
A) Demand shifted from D1 to D2 and supply shifted from S1 to S2.
B) Demand shifted from D1 to D2 and supply shifted from S2 to S1.
C) Demand shifted from D2 to D1 and supply shifted from S1 to S2.
D) Demand shifted from D2 to D1 and supply shifted from S2 to S1.
Correct Answer:
Verified
Q42: Example 2.2 in the textbook explains the
Q43: Which of the following would cause an
Q44: From 1970 to 2017, the real price
Q45: From 1970 to 2017, the real price
Unlock this Answer For Free Now!
View this answer and more for free by performing one of the following actions

Scan the QR code to install the App and get 2 free unlocks

Unlock quizzes for free by uploading documents