 Figure 2.3.2
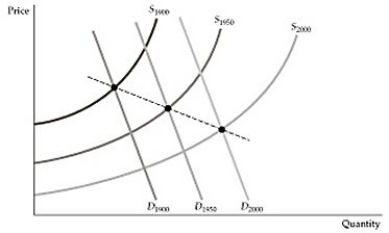
-Figure 2.3.2 above is a reproduction of Figure 2.9 in the textbook, which describes the market for mineral resources across time. The downward-sloping line that crosses the equilibrium points is called:
A) the market decline curve.
B) the market rise path.
C) the long-run path of price and consumption.
D) the industry supply curve.
Correct Answer:
Verified
Q50: Which of the following will cause the
Q51: From 1970 to 2017, the real price
Q52: In example 2.3, the textbook shows a
Q53: The daily demand for hotel rooms on
Q54: Q56: Suppose a new discovery in computer manufacturing Q57: Example 2.2 in the textbook explains the![]()
Unlock this Answer For Free Now!
View this answer and more for free by performing one of the following actions

Scan the QR code to install the App and get 2 free unlocks

Unlock quizzes for free by uploading documents