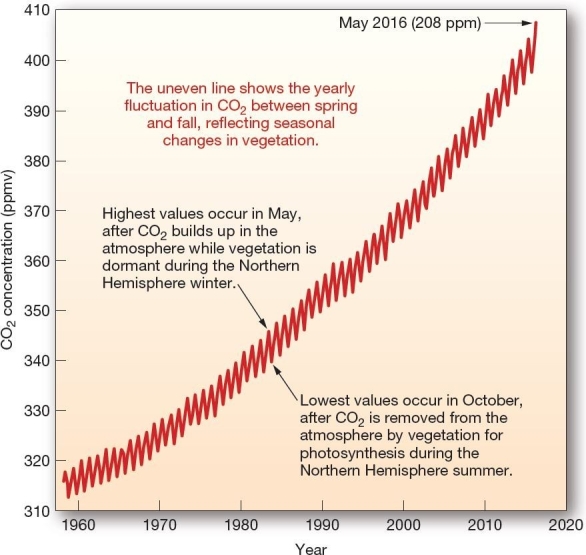
The ____is a graph which plots monthly averages of CO2 concentrations since 1958.
A) Keeling Curve
B) PETM
C) Maunder minimum
D) Younger Dryas
E) MCA
Correct Answer:
Verified
Q54: The process of chemical weathering transfers CO2
Q55: Q56: The primary factors contributing to present sea-level Q57: According to readings from the Mauna Loa Q58: During the last century,sea level Q60: Since 1973,global average specific humidity has Q61: General Circulation Models (GCMs) Q62: As of 2014,which country led the world Q63: Which of the following is incorrect? Q64: The most abundant greenhouse gas in the![]()
A)dropped 3 to
A)increased by
A)are primarily two dimensional
A)Carbon dioxide
Unlock this Answer For Free Now!
View this answer and more for free by performing one of the following actions

Scan the QR code to install the App and get 2 free unlocks

Unlock quizzes for free by uploading documents