The figure given below represents the decision tree of an operations head of a facility who considers a new production technique.ER represents his expected return (in thousand $) from the new technique.If he does not adopt the technique his expected return would be zero.The probabilities of the technique being a success or a failure are 0.7 and 0.3 respectively.Compute the expected return (in thousand $) from the adoption of the new production technique. 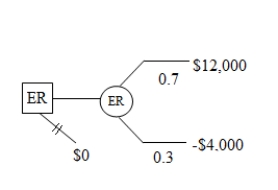
A) $10,000
B) $1,000
C) -$2,000
D) $7,200
E) $8,600
Correct Answer:
Verified
Q13: Which of the following is true of
Q15: Risk aversion describes a person's tendency to:
A)
Q15: The term expected value is defined as:
A)the
Q17: A firm might be liable for $10
Q19: A convenient way to represent decisions,chance events,and
Q20: When there is more than one possible
Q22: An investor estimates the expected return of
Q35: Given the opportunity, a rational decision-maker should
Q36: Consider a situation where an insurance contract
Q37: Apply the expected-value criterion to choose between
Unlock this Answer For Free Now!
View this answer and more for free by performing one of the following actions

Scan the QR code to install the App and get 2 free unlocks

Unlock quizzes for free by uploading documents