The following figure shows the long-run average cost curve of a firm.
Figure 6-1
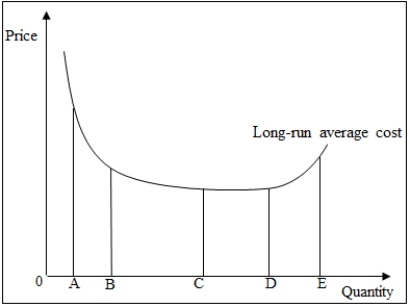
-Refer to Figure 6-1.The production function of the firm displays increasing returns to scale at all levels of output between _____.
A) 0A to 0E
B) 0C to 0D
C) 0D to 0E
D) 0A to 0B
E) 0B to 0E
Correct Answer:
Verified
Q26: A profit-maximizing firm should shut down in
Q29: A profit-maximizing firm will produce at the
Q32: "All fixed costs are sunk costs and
Q34: When the long-run average cost is minimum,the
Q35: The following figure shows the long-run average
Q37: A firm's production function is given by
Q42: Explain the economic logic of the short-run
Q42: The table gives the short-run production data
Q48: A firm's total cost function is: C
Q53: Explain how each of the following events
Unlock this Answer For Free Now!
View this answer and more for free by performing one of the following actions

Scan the QR code to install the App and get 2 free unlocks

Unlock quizzes for free by uploading documents