The following figure shows the long-run average cost curve of a firm.
Figure 6-1
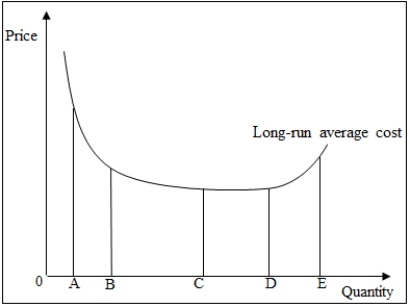
-Refer to Figure 6-1.The production function of the firm displays decreasing returns to scale at all levels of output between _____.
A) 0A to 0E
B) 0C to 0D
C) 0D to 0E
D) 0A to 0B
E) 0B to 0D
Correct Answer:
Verified
Q26: Mexico is capable of producing 20 auto
Q27: A firm will continue to operate in
Q27: Briefly describe the economic cost of a
Q28: A firm's long-run average cost curve is
Q31: What is meant by economies of scope?
A)
Q31: If the price of a product consistently
Q33: The minimum efficient scale is important in
Q34: When the long-run average cost is minimum,the
Q35: The following figure shows the long-run average
Q39: Which of the following correctly defines the
Unlock this Answer For Free Now!
View this answer and more for free by performing one of the following actions

Scan the QR code to install the App and get 2 free unlocks

Unlock quizzes for free by uploading documents