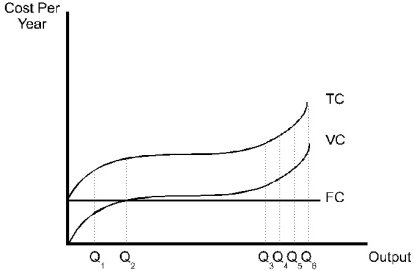
 Figure 7.1
-Refer to Figure 7.1. The diagram above contains ________ cost curves.
A) short run
B) intermediate run
C) long run
D) both short run and long run.
Correct Answer:
Verified
Q24: We typically think of labor as a
Q25: Scenario 7.1:
The average total cost to produce
Q26: Complete the following table:
Total Variable Fixed Marginal
Output
Q27: Scenario 7.1:
The average total cost to produce
Q30: In a short-run production process, the marginal
Q31: Complete the following table (round each answer
Q33: Complete the following table (round each answer
Q38: Use the following two statements to answer
Q39: Complete the following table:
Total Variable Fixed Marginal
Output
Q40: In a short-run production process, the marginal
Unlock this Answer For Free Now!
View this answer and more for free by performing one of the following actions

Scan the QR code to install the App and get 2 free unlocks

Unlock quizzes for free by uploading documents