Exhibit 8-3 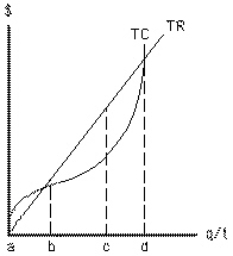 The shape of the total cost curve between outputs a and b in Exhibit 8-3 reflects
A) fixed cost
B) increasing profits
C) diminishing marginal returns
D) increasing marginal returns
E) economies of scale
Correct Answer:
Verified
Q41: Exhibit 8-3 Q42: The demand curve facing a perfectly competitive Q43: Exhibit 8-1 Q44: Exhibit 8-2 Q45: Exhibit 8-1 Q47: Commodity products are Q48: Economic theory assumes that the goal of Q49: The total revenue curve of a perfectly Q50: Exhibit 8-3 Q51: A perfectly competitive firm has no control Unlock this Answer For Free Now! View this answer and more for free by performing one of the following actions Scan the QR code to install the App and get 2 free unlocks Unlock quizzes for free by uploading documents![]()
![]()
![]()
![]()
A)rare and expensive
B)patented and licensed
C)highly![]()

