Multiple Choice
Exhibit 6-29 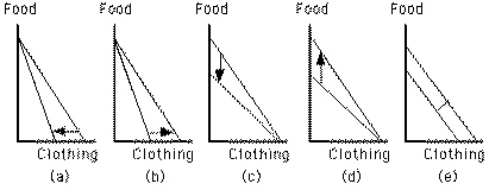 Which graph in Exhibit 6-29 shows the effect of an increase in the price of clothing, other things constant?
A) Graph a
B) Graph b
C) Graph c
D) Graph d
E) Graph e
Correct Answer:
Verified
Related Questions
Q59: A candy bar sells for 50 cents,
Q60: A candy bar sells for 50 cents,
Q61: At consumer equilibrium between goods F and
Q62: Exhibit 6-27 Q63: Exhibit 6-26 Q65: Exhibit 6-29 Q66: Exhibit 6-28 Q67: If the price of apples falls, the Q68: Exhibit 6-28 Q69: Exhibit 6-27 Unlock this Answer For Free Now! View this answer and more for free by performing one of the following actions Scan the QR code to install the App and get 2 free unlocks Unlock quizzes for free by uploading documents![]()
![]()
![]()
![]()
![]()
![]()

