Exhibit 5-25 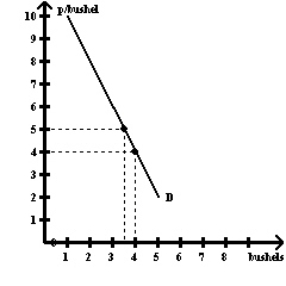 Exhibit 5-25 shows a hypothetical demand curve for soybeans.The vertical axis measures the average price per bushel in dollars.The horizontal axis measures billions of bushels per year.If perfect weather boosts the harvest from 3.5 billion bushels to 4.0 billion bushels (a 13 percent increase) , what must happen to average price in order for the increased production to be sold?
A) The average price must increase by $1 per bushel, a 22 percent increase.
B) The average price will remain at $5 per bushel.
C) The average price must fall by $0.58 per bushel, a 13 percent decrease.
D) The average price must fall by $1 per bushel, a 22 percent decrease.
E) It is not possible to answer without knowing exactly how much supply decreases.
Correct Answer:
Verified

