Exhibit 4-1 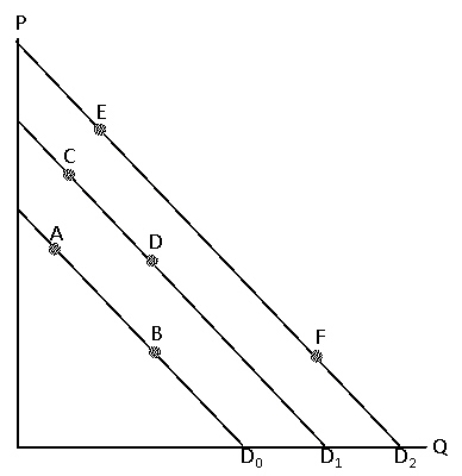 Consider Exhibit 4-1 which shows 3 demand curves for corn flakes.Which of the following would be most likely to shift the demand curve from D0 to D1?
A) a report that eating corn flakes reduces the risk of cancer
B) an increase in consumer incomes if corn flakes is an inferior good
C) a decrease in the price of oatmeal which many consumers consider to be a substitute for corn flakes
D) an increase in the price milk which many consumers consider to be complement for corn flakes
E) a decrease in the number of consumers
Correct Answer:
Verified
Q32: The income effect of a decrease in
Q33: Exhibit 4-1 Q34: The demand curve for spinach shows the Q35: The income effect of an increase in Q36: Studies show that the demand curve for Q38: The effect of a decrease in the![]()
Unlock this Answer For Free Now!
View this answer and more for free by performing one of the following actions

Scan the QR code to install the App and get 2 free unlocks

Unlock quizzes for free by uploading documents