Exhibit 4-1 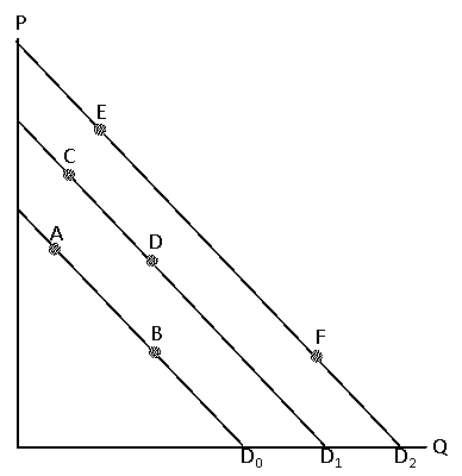 Consider Exhibit 4-1 which shows 3 demand curves for corn flakes.Which of the following would be most likely to shift the demand curve from D2 to D1?
A) a report that eating corn flakes decrreases the risk of cancer
B) an increase in consumer incomes if corn flakes is a normal good
C) an increase in the price of oatmeal which many consumers consider to be a substitute for corn flakes
D) an increase in the price milk which many consumers consider to be complement for corn flakes
E) a widely anticipated recession
Correct Answer:
Verified
Q19: The demand for a product is the
Q20: The income effect refers to the impact
Q21: Exhibit 4-1 Q22: Exhibit 4-1 Q23: Exhibit 4-1 Q25: Exhibit 4-1 Q26: Which of the following will not shift Q27: A demand curve usually has a Q28: Which of the following is not true Q29: Exhibit 4-1 Unlock this Answer For Free Now! View this answer and more for free by performing one of the following actions Scan the QR code to install the App and get 2 free unlocks Unlock quizzes for free by uploading documents![]()
![]()
![]()
![]()
A)negative slope![]()

