Multiple Choice
Exhibit 2-10 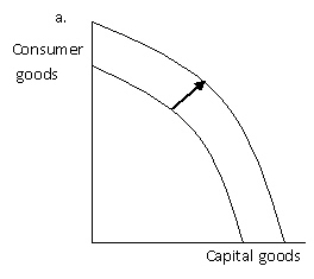
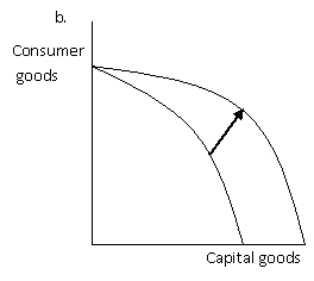
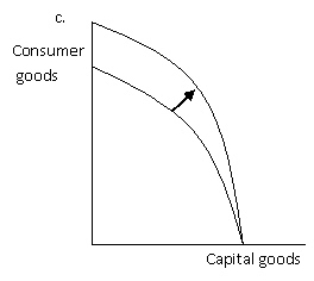
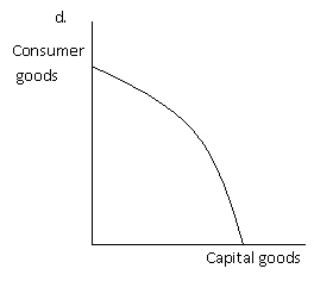 Refer to Exhibit 2-10.Which of the graphs best illustrates the impact on the production possibilities frontier of a decrease in unemployment?
A) a
B) b
C) c
D) d
E) a, b and c
Correct Answer:
Verified
Related Questions
Q194: When faced with a choice, a person
Q195: One of the most centrally planned economies
Q196: Exhibit 2-10 Q197: Based on an analysis of opportunity cost, Q198: All of the following are evidence of Q200: The "rules of the game, " the Q201: Exhibit 2-12 Maria and Hans Production Possibilities![]()
Unlock this Answer For Free Now!
View this answer and more for free by performing one of the following actions

Scan the QR code to install the App and get 2 free unlocks

Unlock quizzes for free by uploading documents