Exhibit 2-10 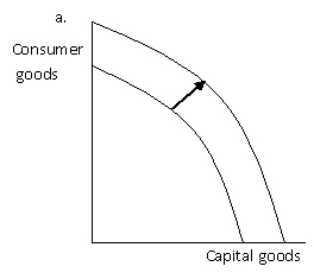
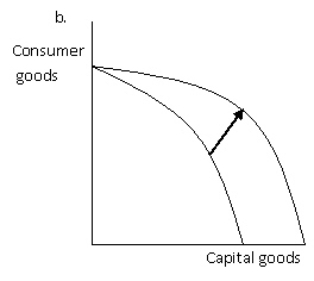
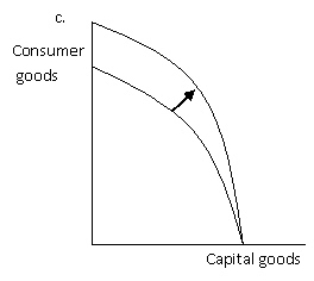
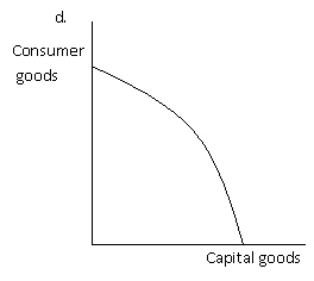 Refer to Exhibit 2-10.Which of the graphs best illustrates the impact on the production possibilities frontier of a technological improvement that will make the resources used to produce consumer goods more efficient?
A) a
B) b
C) c
D) d
E) b and c
Correct Answer:
Verified
Q182: The U.S.economy is best characterized as
A)pure capitalism
B)a
Q183: Exhibit 2-11 Q184: The primary differences in economic structure among Q185: A mixed capitalist economy is one in Q186: A PPF will not shift because of Q188: Exhibit 2-11 Q189: People have less incentive to invest the Q190: The law of comparative advantage does not Q191: Recognizing the incentive power of property rights Q192: Exhibit 2-11 Unlock this Answer For Free Now! View this answer and more for free by performing one of the following actions Scan the QR code to install the App and get 2 free unlocks Unlock quizzes for free by uploading documents![]()
![]()
![]()

