Use the following to answer question: 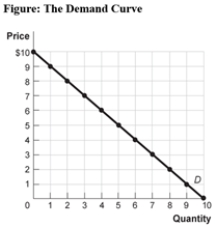
-(Figure: The Demand Curve) Use Figure: The Demand Curve.By the midpoint method,the price elasticity of demand between $1 and $2 is approximately:
A) 0.18.
B) 0.56.
C) 1.80.
D) 5.67.
Correct Answer:
Verified
Q148: Eric's income increased from $40,000 to $50,000
Q149: Use the following to answer question:
Q150: If your purchases of shoes decrease from
Q151: If your purchases of shoes increase from
Q152: Nico rents 10% more DVDs when his
Q154: Use the following to answer question:
Q155: Kayla and Jada are roommates in New
Q156: If the income elasticity for hybrid cars
Q157: The income elasticity of demand for peaches
Q158: The income elasticity of demand for eggs
Unlock this Answer For Free Now!
View this answer and more for free by performing one of the following actions

Scan the QR code to install the App and get 2 free unlocks

Unlock quizzes for free by uploading documents