Use the following to answer question: 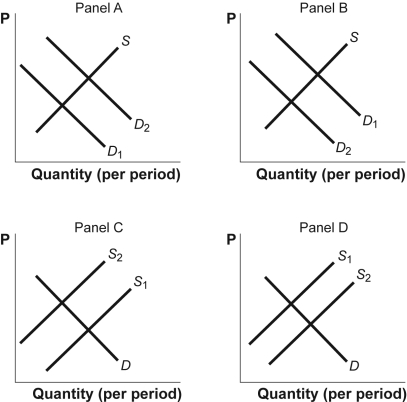
-(Figure: Shifts in Demand and Supply II) Use Figure: Shifts in Demand and Supply II.The graph shows how supply and demand might shift in response to specific events.Suppose a drought destroys one-third of the nation's peanut crop.Which panel BEST describes how this will affect the market for peanuts?
A) Panel A
B) Panel B
C) Panel C
D) Panel D
Correct Answer:
Verified
Q120: Use the following to answer question:
Q121: Use the following to answer question:
Q122: Use the following to answer question:
Q123: Use the following to answer question:
Q124: Use the following to answer question:
Q126: Use the following to answer question:
Q127: Use the following to answer question:
Q128: Use the following to answer question:
Q129: Use the following to answer question:
Q130: Use the following to answer question:
Unlock this Answer For Free Now!
View this answer and more for free by performing one of the following actions

Scan the QR code to install the App and get 2 free unlocks

Unlock quizzes for free by uploading documents