Use the following to answer question: 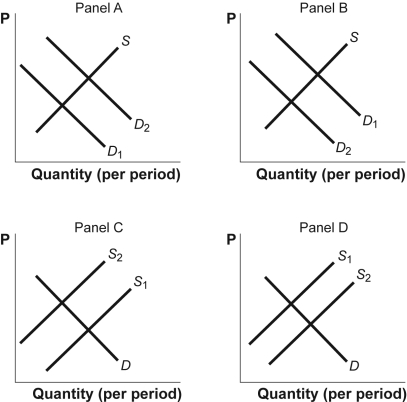
-(Figure: Shifts in Demand and Supply III) Use Figure: Shifts in Demand and Supply III.The figure shows how supply and demand might shift in response to specific events.Suppose a wet and sunny year increases the nation's corn crop by 20%.Which panel BEST describes how this will affect the market for corn?
A) Panel A
B) Panel B
C) Panel C
D) Panel D
Correct Answer:
Verified
Q132: Use the following to answer question:
Q133: Use the following to answer question:
Q134: Use the following to answer question:
Q135: Use the following to answer question:
Q136: Use the following to answer question:
Q138: Use the following to answer question:
Q139: Use the following to answer question:
Q140: Use the following to answer question:
Q141: If supply is upward sloping,an increase in
Q142: Use the following to answer question:
Unlock this Answer For Free Now!
View this answer and more for free by performing one of the following actions

Scan the QR code to install the App and get 2 free unlocks

Unlock quizzes for free by uploading documents