Use the following to answer question: 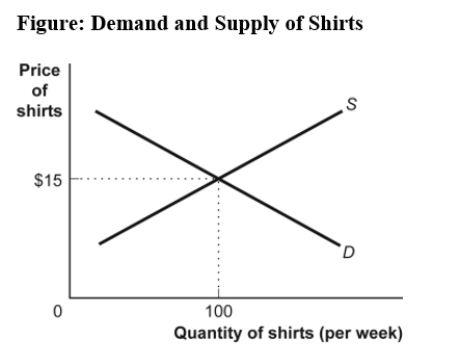
-(Figure: Demand and Supply of Shirts) Use Figure: Demand and Supply of Shirts.In the graph,if the line labeled D shows how many shirts per week will be demanded at various prices,then it is clear that,as the price of shirts falls:
A) fewer shirts will be demanded.
B) more shirts will be demanded.
C) the same quantity of shirts will be demanded.
D) it is unclear what will happen to the quantity of shirts demanded.
Correct Answer:
Verified
Q4: Use the following to answer question:
Q5: Use the following to answer question:
Q6: Use the following to answer question:
Q7: If two variables are negatively related,they will
Q8: On a two-dimensional graph representing two variables:
A)a
Q10: Use the following to answer question:
Q11: The _ of a curve shows the
Q12: Use the following to answer question:
Q13: Use the following to answer question:
Q14: (Table: Hours Studied and Quiz Score)Use Table:
Unlock this Answer For Free Now!
View this answer and more for free by performing one of the following actions

Scan the QR code to install the App and get 2 free unlocks

Unlock quizzes for free by uploading documents