Use the following to answer question: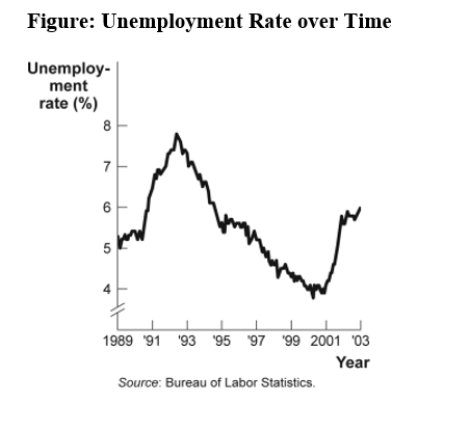
-(Figure: Unemployment Rate over Time) Use Figure: Unemployment Rate over Time.In the time-series graph,as we move from 1997 to 2001,we see that the unemployment rate has _____ from approximately _____% to approximately _____%.
A) decreased;5;4
B) increased;5.3;7.3
C) decreased;7.8;5.5
D) increased;4;6.3
Correct Answer:
Verified
Q37: Use the following to answer question:
Q38: Use the following to answer question:
Q39: Use the following to answer question:
Q40: Use the following to answer question:
Q41: A pie chart is used to depict
Q43: Use the following to answer question:
Q44: Professor Macro wants to use a numerical
Q45: A linear curve has the same slope
Q46: A scatter diagram shows:
A)how far apart dependent
Q47: Use the following to answer question:
Unlock this Answer For Free Now!
View this answer and more for free by performing one of the following actions

Scan the QR code to install the App and get 2 free unlocks

Unlock quizzes for free by uploading documents