Use the following to answer question: 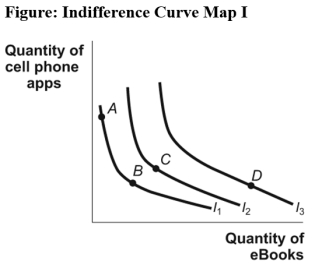
-(Figure: Indifference Curve Map I) Use Figure Indifference Curve Map I.It shows that:
A) at point A utility is higher than it is at point B.
B) utility is diminishing on I1,constant on I2,and increasing on I3.
C) utility is higher at point D than at point A.
D) the marginal utility of e-books is positive,while the marginal utility of cell phone apps is negative.
Correct Answer:
Verified
Q26: Use the following to answer question:
Q27: Use the following to answer question:
Q28: One point on an indifference curve that
Q29: Suppose peanut butter is an inferior good
Q30: Greater levels of utility are represented by:
A)indifference
Q32: In terms of indifference curves,a demand curve
Q33: An indifference curve typically:
A)slopes downward.
B)shows combinations of
Q34: A _ can be generated from indifference
Q35: Max consumes only yogurt and almonds,and he
Q36: The slope of a(n)_ curve shows the
Unlock this Answer For Free Now!
View this answer and more for free by performing one of the following actions

Scan the QR code to install the App and get 2 free unlocks

Unlock quizzes for free by uploading documents