Use the figure below to answer the following questions. 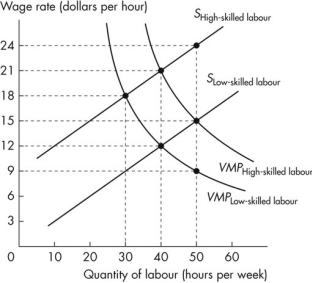 Figure 18.3.5
-Refer to Figure 18.3.5.This figure shows the labour supply curves and the value of marginal product curves for high-skilled and low-skilled workers.The equilibrium wage rate for low-skilled workers is
A) $9 an hour.
B) $21 an hour.
C) $18 an hour.
D) $15 an hour.
E) $12 an hour.
Correct Answer:
Verified
Q70: Use the figure below to answer the
Q71: Which of the following three statements is
Q72: Use the figure below to answer the
Q73: Use the figure below to answer the
Q74: Other things remaining the same,if education costs
Q76: If discrimination takes the form of consumers
Q77: Use the figure below to answer the
Q78: Assortative mating means that
A)poor men tend to
Q79: Which of the following statements is false?
Q80: Use the figure below to answer the
Unlock this Answer For Free Now!
View this answer and more for free by performing one of the following actions

Scan the QR code to install the App and get 2 free unlocks

Unlock quizzes for free by uploading documents