Use the figure below to answer the following questions. 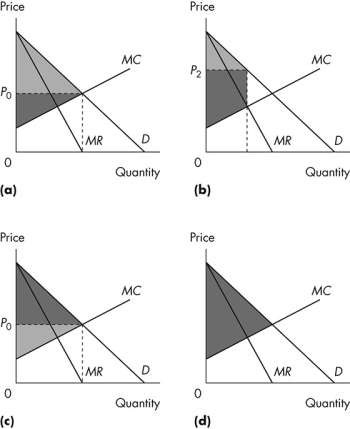 Figure 12.3.2
-Consider Figure 12.3.2.The light grey area shows consumer surplus,and the dark grey area shows producer surplus.Which graph illustrates a perfectly competitive market?
A) (a)
B) (b)
C) (c)
D) (d)
E) (b) and (d)
Correct Answer:
Verified
Q46: Use the figure below to answer the
Q47: Use the figure below to answer the
Q48: Use the figure below to answer the
Q49: Use the figure below to answer the
Q50: Rent seeking
A)is an attempt by landlords to
Q52: Use the figure below to answer the
Q53: Rent seeking
A)is a variable cost and with
Q54: Use the figure below to answer the
Q55: Use the figure below to answer the
Q56: Use the figure below to answer the
Unlock this Answer For Free Now!
View this answer and more for free by performing one of the following actions

Scan the QR code to install the App and get 2 free unlocks

Unlock quizzes for free by uploading documents