Use the figure below to answer the following question. 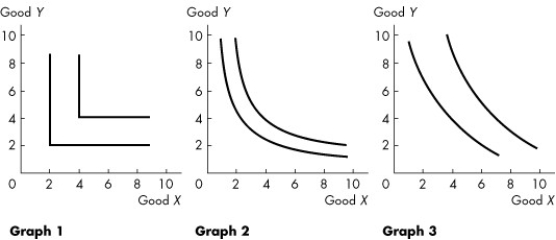 Figure 9.2.5
-Refer to Figure 9.2.5.The graphs show indifference curves for various goods.Graph ________ best describes the pair of goods baseballs and baseball bats.Graph ________ best describes the pair of goods desktop computers and laptop computers.
A) 2;3
B) 2;1
C) 1;1
D) 1;3
E) 3;2
Correct Answer:
Verified
Q57: The marginal rate of substitution
A)is the amount
Q58: A constant marginal rate of substitution between
Q59: Use the figure below to answer the
Q60: A consumer considers Coke and Pepsi to
Q61: Leah consumes at a point on her
Q63: Use the figure below to answer the
Q64: Which one of the following statements is
Q65: Leah consumes at a point on her
Q66: Use the figure below to answer the
Q67: An indifference curve slopes downward because
A)it shows
Unlock this Answer For Free Now!
View this answer and more for free by performing one of the following actions

Scan the QR code to install the App and get 2 free unlocks

Unlock quizzes for free by uploading documents