Use the figure below to answer the following questions. 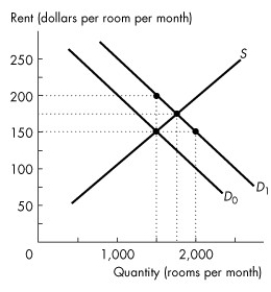 Figure 6.1.1
-Consider the market for rental housing illustrated in Figure 6.1.1 when the demand curve is D0.The equilibrium in an unregulated market is
A) 1,500 rooms rented at $150 a month.
B) 1,500 rooms rented at $200 a month.
C) 1,750 rooms rented at $175 a month.
D) 1,750 rooms rented at $200 a month.
E) 2,000 rooms rented at $150 a month.
Correct Answer:
Verified
Q14: An illegal market in which the equilibrium
Q15: Use the figure below to answer the
Q16: Use the figure below to answer the
Q17: If a rent ceiling imposed by the
Q18: Use the figure below to answer the
Q20: In an unregulated housing market with no
Q21: Use the table below to answer the
Q22: An effective rent ceiling
A)increases producer surplus.
B)results in
Q23: Use the figure below to answer the
Q24: Use the table below to answer the
Unlock this Answer For Free Now!
View this answer and more for free by performing one of the following actions

Scan the QR code to install the App and get 2 free unlocks

Unlock quizzes for free by uploading documents