Use the figure below to answer the following question. 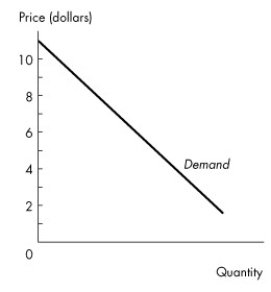 Figure 4.1.1
-Figure 4.1.1 illustrates a linear demand curve.Comparing the price elasticity when price is $3 with the price elasticity when price is $8,we can conclude that
A) demand is more elastic when price is $8.
B) demand is more elastic when price is $3.
C) the price elasticity of demand is equal when price is $8 and when price is $3.
D) demand is elastic when price is $8 and unit elastic when price is $3.
E) demand is inelastic when price is $3 and unit elastic when price is $8.
Correct Answer:
Verified
Q27: For which one of the following is
Q28: For which one of the following will
Q29: Suppose the quantity of root beer demanded
Q30: Demand will be more elastic the
A)lower the
Q31: Use the table below to answer the
Q33: For which one of the following will
Q34: Use the figure below to answer the
Q35: Demand will be more inelastic the
A)lower the
Q36: Suppose the Lethbridge Computer Company decides to
Q37: Suppose the government of Nova Scotia wants
Unlock this Answer For Free Now!
View this answer and more for free by performing one of the following actions

Scan the QR code to install the App and get 2 free unlocks

Unlock quizzes for free by uploading documents