Use the figure below to answer the following question. 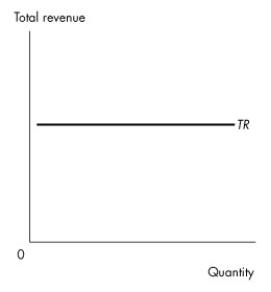 Figure 4.1.3
-Given the relationship shown in Figure 4.1.3 between total revenue from the sale of a good and the quantity of the good sold,then
A) this is an inferior good.
B) this is a normal good.
C) the price elasticity of demand is zero.
D) demand for this good is perfectly elastic.
E) the price elasticity of demand is 1.
Correct Answer:
Verified
Q60: The price of gasoline rises by 25
Q61: If the demand for good Z is
Q62: Suppose the demand curve for good X
Q63: Use the table below to answer the
Q64: When the price of peanut butter rises
Q66: Suppose there is an increase in the
Q67: A good has a price elasticity of
Q68: If Saudi Arabia argues that an increase
Q69: Use the table below to answer the
Q70: The demand for orange juice is price
Unlock this Answer For Free Now!
View this answer and more for free by performing one of the following actions

Scan the QR code to install the App and get 2 free unlocks

Unlock quizzes for free by uploading documents