Use the figure below to answer the following questions. 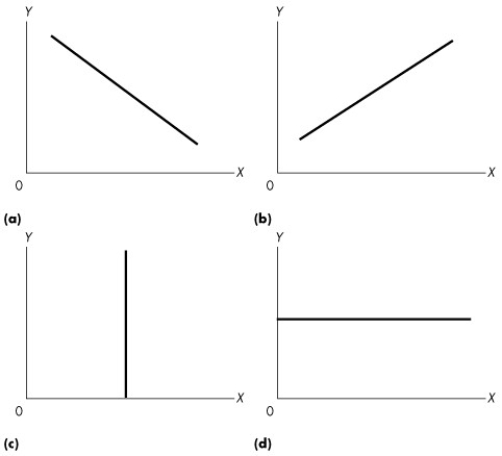 Figure 1A.2.4
-Refer to Figure 1A.2.4.If theory predicts that a rise in the wage rate (x) leads to a rise in the amount of labour supplied in the economy (y) ,which graph represents this relationship?
A) (a)
B) (b)
C) (c)
D) (d)
E) (a) or (c)
Correct Answer:
Verified
Q130: Consider graph (b)of Figure 1A.2.1.Which one of
Q131: If variables x and y move up
Q132: Use the figure below to answer the
Q133: Use the figure below to answer the
Q134: Use the figure below to answer the
Q136: Use the figure below to answer the
Q137: The relationship between two variables that move
Q138: Two variables are negatively related if
A)increases in
Q139: Two variables are positively related if
A)increases in
Q140: Use the figure below to answer the
Unlock this Answer For Free Now!
View this answer and more for free by performing one of the following actions

Scan the QR code to install the App and get 2 free unlocks

Unlock quizzes for free by uploading documents