Use the figure below to answer the following questions. 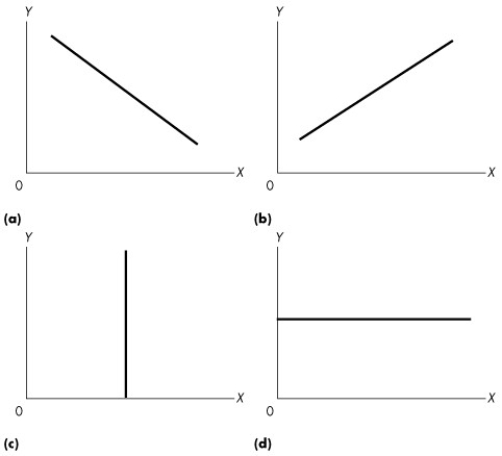 Figure 1A.2.4
-Refer to Figure 1A.2.4.Suppose theory predicted that for low levels of quantity produced (x) a firm's profits (y) were low,for medium levels of output their profits were high,and for high levels of output their profits were low again.Which one of the graphs would represent this relationship?
A) (a)
B) (b)
C) (c)
D) (d)
E) none of the graphs
Correct Answer:
Verified
Q120: Choose the correct option regarding the earnings
Q121: Use the figure below to answer the
Q122: Use the table below to answer the
Q123: The relationship between two variables that are
Q124: Use the figure below to answer the
Q126: Use the figure below to answer the
Q127: The relationship between two variables that are
Q128: Consider graph (d)of Figure 1A.2.1.Which one of
Q129: Use the figure below to answer the
Q130: Consider graph (b)of Figure 1A.2.1.Which one of
Unlock this Answer For Free Now!
View this answer and more for free by performing one of the following actions

Scan the QR code to install the App and get 2 free unlocks

Unlock quizzes for free by uploading documents