Use the figure below to answer the following question. 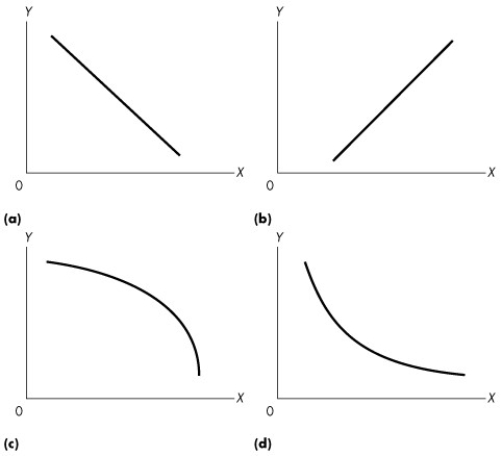 Figure 1A.2.7
-Refer to Figure 1A.2.7.Consider the values for x and y given in the following table: 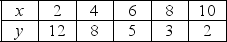 Which one of the graphs in Figure 1A.2.7 represents the relationship between x and y?
A) (a)
B) (b)
C) (c)
D) (d)
E) (a) and (b)
Correct Answer:
Verified
Q138: Two variables are negatively related if
A)increases in
Q139: Two variables are positively related if
A)increases in
Q140: Use the figure below to answer the
Q141: Use the table below to answer the
Q142: Use the figure below to answer the
Q144: Use the figure below to answer the
Q145: Use the figure below to answer the
Q146: Use the figure below to answer the
Q147: Use the figure below to answer the
Q148: The slope of a straight line
A)is the
Unlock this Answer For Free Now!
View this answer and more for free by performing one of the following actions

Scan the QR code to install the App and get 2 free unlocks

Unlock quizzes for free by uploading documents