Use the figure below to answer the following questions. 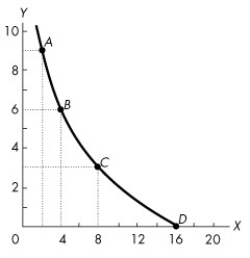 Figure 1A.3.4
-Figure 1A.3.4 illustrates two variables,x and y,which are
A) negatively related,with slope becoming closer to 0 as x increases from 2 to 16.
B) negatively related,with slope becoming farther from 0 as x increases from 2 to 16.
C) positively related,with slope becoming closer to 0 as x increases from 2 to 16.
D) positively related,with slope becoming farther from 0 as x increases from 2 to 16.
E) positively related,with the slope unchanging as x increases from 2 to 16.
Correct Answer:
Verified
Q144: Use the figure below to answer the
Q145: Use the figure below to answer the
Q146: Use the figure below to answer the
Q147: Use the figure below to answer the
Q148: The slope of a straight line
A)is the
Q150: Use the figure below to answer the
Q151: Use the table below to answer the
Q152: What is the slope across the arc
Q153: Use the figure below to answer the
Q154: Use the figure below to answer the
Unlock this Answer For Free Now!
View this answer and more for free by performing one of the following actions

Scan the QR code to install the App and get 2 free unlocks

Unlock quizzes for free by uploading documents