 Figure 4.4
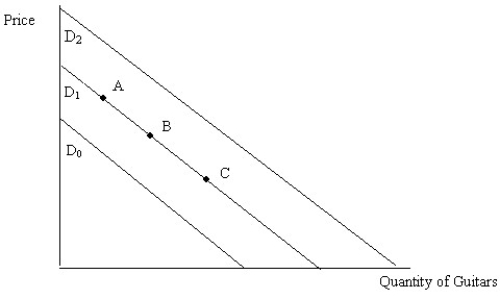
-Figure 4.4 illustrates the demand for guitars.An increase in the demand for guitars is represented by the movement from:
A) point B to point C.
B) point B to point A.
C) D1 to D0.
D) D1 to D2.
Correct Answer:
Verified
Q101: When Tom's income decreases,he purchases more hamburgers.We
Q102: When Mary's income increases,she purchases fewer hamburgers.We
Q103: Which of the following is the least
Q110: The effect of income on the demand
Q123: Q123: Assume that compact discs and compact disc Q124: When the price of peanuts falls: Unlock this Answer For Free Now! View this answer and more for free by performing one of the following actions Scan the QR code to install the App and get 2 free unlocks Unlock quizzes for free by uploading documents![]()
A)the demand

