 Figure 4.5
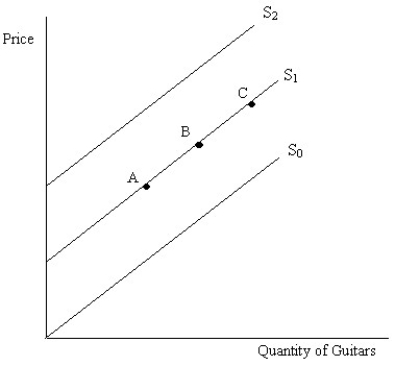
-Figure 4.5 illustrates the supply of guitars.An increase in the supply of guitars is represented by a movement from:
A) point B to point C.
B) point B to point A.
C) S1 to S0.
D) S1 to S2.
Correct Answer:
Verified
Q179: Can we infer that pecans are normal
Q180: An increase or decrease in population will
Q181: Q182: If a technological advance makes it possible Q185: A decrease in the tuition (i.e. ,price)that Q185: What does a decrease in population do Q186: If the number of beer producers decreases, Q188: A decrease in the amount of subsidies![]()
A)
Unlock this Answer For Free Now!
View this answer and more for free by performing one of the following actions

Scan the QR code to install the App and get 2 free unlocks

Unlock quizzes for free by uploading documents