 Figure 4.6
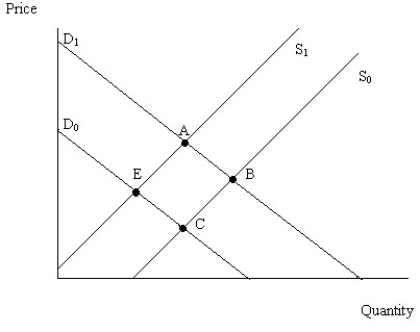
-Figure 4.6 illustrates a set of supply and demand curves for a product.When the economy moves from point B to point A,there has been:
A) an increase in supply and an increase in demand.
B) an decrease in supply and an decrease in quantity demanded.
C) an increase in quantity supplied and an increase in demand.
D) an increase in quantity supplied and an increase in quantity demanded.
Correct Answer:
Verified
Q221: Q226: Using a graph,illustrate the effect that an Q229: When a government pays a company for Q230: Using supply and demand analysis,if the "colony Q230: The market equilibrium price and quantity can Q233: According to the application,the increase in the![]()
Unlock this Answer For Free Now!
View this answer and more for free by performing one of the following actions

Scan the QR code to install the App and get 2 free unlocks

Unlock quizzes for free by uploading documents