Figure 2.1
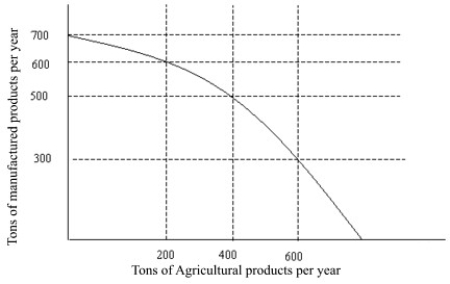
-The production possibilities curve in Figure 2.1 illustrates the notion of
A) increased factory goods production.
B) increased farm produce production.
C) diminishing resources.
D) opportunity cost.
Correct Answer:
Verified
Q17: Suppose that your tuition to attend college
Q18: The principle of opportunity cost
A) is more
Q18: The trade-offs made by the U.S. government
Q19: The saying that "There's no such thing
Q23: If an economy is fully utilizing its
Q23: Figure 2.1 Q24: Table 2.1 Q25: Opportunity cost is the difference between the Q26: Figure 2.1 Q27: Figure 2.1 Unlock this Answer For Free Now! View this answer and more for free by performing one of the following actions Scan the QR code to install the App and get 2 free unlocks Unlock quizzes for free by uploading documents
![]()
![]()
![]()
![]()

