Multiple Choice
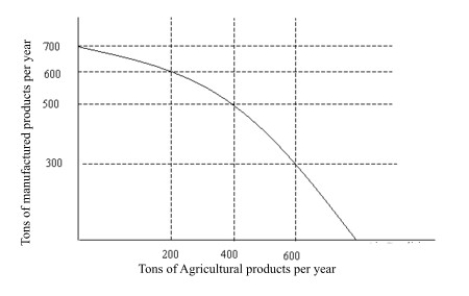 Figure 2.1
-On the production possibilities curve in Figure 2.1 the gain from decreasing manufacturing production from 700 tons to 500 tons is:
A) 700 tons of agriculture.
B) 500 tons of agriculture.
C) 200 tons of agriculture.
D) 100 tons of agriculture.
Correct Answer:
Verified
Related Questions

