The following diagram represents the ownership of issued share capital of the companies in a group.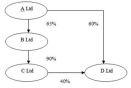
A) 12.6%; 23.4%;
B) 23.4%; 12.6%;
C) 40%; 60%;
D) 60%; 40%;
E) 83.4%; 12.6%.
Correct Answer:
Verified
Q22: The following diagram represents the ownership of
Q23: Jabba Ltd acquired a 70 per cent
Q24: Pasta Ltd acquired an 80 per cent
Q25: The following diagram represents the ownership of
Q26: The following acquisition analysis relates to a
Q28: The following is an extract from the
Q29: Jabba Ltd acquired a 70 per cent
Q30: Which of the following statements are incorrect?
A)
Q31: The following is an extract from the
Q32: The following is an extract from the
Unlock this Answer For Free Now!
View this answer and more for free by performing one of the following actions

Scan the QR code to install the App and get 2 free unlocks

Unlock quizzes for free by uploading documents