The graph in the figure shows the net force acting on a 3.0-kg object as a function of time. 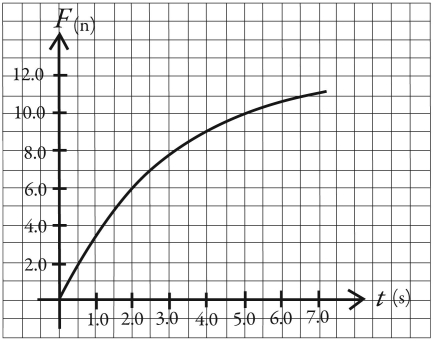
(a) What is the acceleration of this object at time t = 2.0 s?
(b) Draw, to scale, a graph of the acceleration of this object as a function of time over the range t = 0.00 s to t = 7.0 s.
Correct Answer:
Verified
(b) The accelerati...
View Answer
Unlock this answer now
Get Access to more Verified Answers free of charge
Q14: You are standing in a moving bus,facing
Q18: Which one of the following free-body diagrams
Q20: The figure shows an acceleration-versus-force graph for
Q21: The figure shows a graph of the
Q21: On its own,a certain tow-truck has a
Q22: The figure shows a graph of the
Q26: The figure shows two forces acting at
Q27: Two forces act on a 55-kg object.
Q28: An object weighing 4.00 N falls from
Q31: A child on a sled starts from
Unlock this Answer For Free Now!
View this answer and more for free by performing one of the following actions

Scan the QR code to install the App and get 2 free unlocks

Unlock quizzes for free by uploading documents