The graph in the figure shows the electric field strength (not the field lines) as a function of distance from the center for a pair of concentric uniformly charged spheres. Which of the following situations could the graph plausibly represent? (There may be more than one correct choice.) 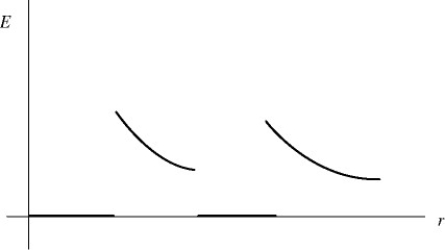
A) a positively charged conducting sphere within another positively charged conducting sphere
B) a positively charged conducting sphere within an uncharged conducting sphere
C) a solid nonconducting sphere, uniformly charged throughout its volume, inside of a positively charged conducting sphere
D) a positively charged nonconducting thin-walled spherical shell inside of a positively charged conducting sphere
E) a positively charged nonconducting thin-walled spherical shell inside of another positively charged nonconducting thin-walled spherical shell
Correct Answer:
Verified
Q2: Two concentric conducting spherical shells produce a
Q10: Two long straight parallel lines,#1 and #2,carry
Q16: If the electric flux through a closed
Q17: At a distance D from a very
Q18: Two concentric spheres are shown in the
Q19: A charge of 1.0 × 10⁻⁶ μC
Q22: A non-conducting sphere of radius R =
Q27: A neutral hollow spherical conducting shell of
Q30: A solid nonconducting sphere of radius R
Q36: Electric charge is uniformly distributed inside a
Unlock this Answer For Free Now!
View this answer and more for free by performing one of the following actions

Scan the QR code to install the App and get 2 free unlocks

Unlock quizzes for free by uploading documents