An object starts its motion with a constant velocity of 2.0 m/s toward the east. After 3.0 s, the object stops for 1.0 s. The object then moves toward the west a distance of 2.0 m in 3.0 s. The object continues traveling in the same direction, but increases its speed by 1.0 m/s for the next 2.0 s. Which graph below could represent the motion of this object?
A) 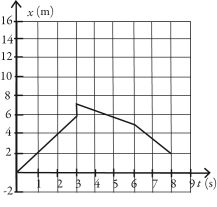
B) 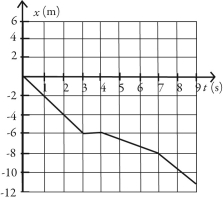
C) 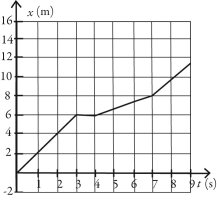
D) 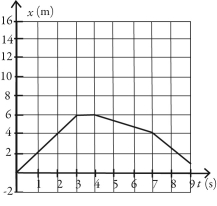
Correct Answer:
Verified
Q1: The figure shows the position of an
Q4: Which one of the following graphs could
Q6: An object is moving in a straight
Q8: A ball is thrown directly upward and
Q8: The graph in the figure shows the
Q10: The figure shows the velocity of a
Q13: Two objects are thrown from the top
Q15: If the graph of the position as
Q16: Two objects are dropped from a bridge,an
Q20: If an object is accelerating toward a
Unlock this Answer For Free Now!
View this answer and more for free by performing one of the following actions

Scan the QR code to install the App and get 2 free unlocks

Unlock quizzes for free by uploading documents