A graph of the force on an object as a function of its position is shown in the figure. Determine the amount of work done by this force on an object that moves from x = 1.0 m to x = 6.0 m. (Assume an accuracy of 2 significant figures for the numbers on the graph.) 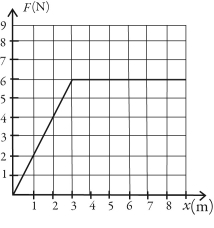
A) 26 J
B) 29 J
C) 22 J
D) 35 J
E) 27 J
Correct Answer:
Verified
Q1: Which,if any,of the following statements concerning the
Q2: You carry a 7.0 kg bag of
Q4: An airplane flies 120 km at a
Q23: A 1000 kg car experiences a net
Q38: A ball is thrown upward at an
Q42: In the figure, a 900-kg crate is
Q43: A child pulls on a wagon with
Q44: In the figure, a 700-kg crate is
Q47: A force Q48: A constant horizontal pull acts on a![]()
Unlock this Answer For Free Now!
View this answer and more for free by performing one of the following actions

Scan the QR code to install the App and get 2 free unlocks

Unlock quizzes for free by uploading documents