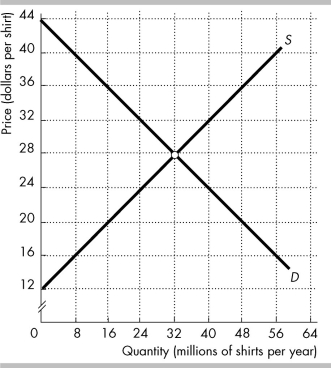
 The figure shows the market for shirts in the United States, where D is the domestic demand curve and S is the domestic supply curve. The world price is $20 per shirt. The United States imposes a tariff on imported shirts of $4 per shirt.
-In the figure above, the U.S. government's revenue from the tariff is
A) $64 million.
B) $32 million.
C) $128 million.
D) $48 million.
Correct Answer:
Verified
Q72: The current U.S. average tariff rate
A) less
Q73: Which of the following best describes the
Q74: Of the following, in which decade were
Q75: The Smoot-Hawley Act was enacted in
A) 1980.
B)
Q76: An import quota specifies the
A) highest price
Unlock this Answer For Free Now!
View this answer and more for free by performing one of the following actions

Scan the QR code to install the App and get 2 free unlocks

Unlock quizzes for free by uploading documents