Multiple Choice
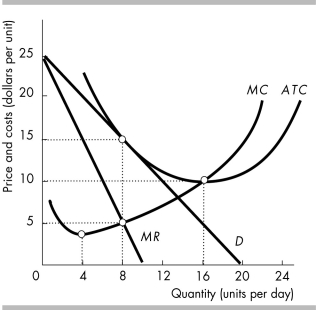
-The above figure shows the demand and cost curves for a firm in monopolistic competition in the long run. The firm maximizes its profit by
A) producing 4 units and charging a price of $15.
B) producing 8 units and charging a price of $5.
C) producing 16 units and charging a price of $10.
D) None of the above answers is correct.
Correct Answer:
Verified
Related Questions

