Figure 16-3
Panel (a) Panel (b) 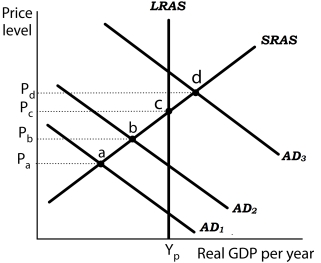
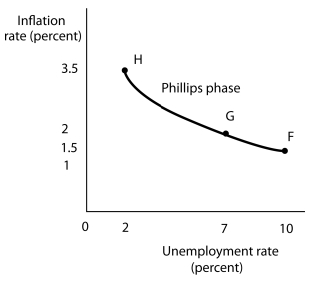 Suppose the level of potential output (YP) is $1,000 billion and the natural rate of unemployment is 5%. In Panel (a) , the aggregate demand curve in Period 1 is AD1. Assume that the price level in Period 1 has risen by 1.5% from the previous period and the unemployment rate is 10%. Thus, in Panel (b) point F shows an initial rate of inflation of 1.5% and an unemployment rate of 10%. Similarly, point b in Panel (a) corresponds to point G in Panel (b) and point d in Panel (a) corresponds to point H in Panel (b) .
-Refer to Figure 16-3. In the Phillips phase of the inflation-unemployment cycle,
A) aggregate demand is stagnant.
B) real GDP rises in each successive period.
C) inflation and unemployment fall in each successive period.
D) real GDP falls in each successive period.
Correct Answer:
Verified
Q30: During a Phillips phase,
A) inflation and unemployment
Q35: Figure 16-2 Q36: Figure 16-2 Q37: In the early 1970s, President Nixon inherited Q37: During a stagflation phase, Q40: Prior to the 1970s, the model of Q42: Figure 16-6 Q43: The Phillips phase of the inflation-unemployment relationship Q43: Figure 16-6 Q44: Figure 16-3 Unlock this Answer For Free Now! View this answer and more for free by performing one of the following actions Scan the QR code to install the App and get 2 free unlocks Unlock quizzes for free by uploading documents![]()
![]()
A) inflation and unemployment![]()
![]()
Panel (a) Panel (b) 

