Figure 16-7 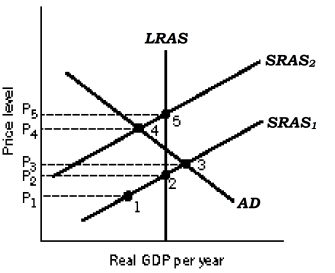
-Refer to Figure 16-7. Over time, the aggregate supply curve shifts from SRAS1 to SRAS2 Jbecause of
A) rising output prices.
B) economic agents adjust their expectations regarding prices and wages downwards.
C) a fall in nominal wages.
D) economic agents adjust their expectations regarding prices and wages upwards.
Correct Answer:
Verified
Q43: Figure 16-6 Q44: Figure 16-3 Q45: Figure 16-7 Q46: The essential feature of a stagflation phase Q47: Figure 16-7 Q49: The critical feature of the Q52: In a stagflation phase, a decrease in Q52: Figure 16-3 Q53: Figure 16-6 Q54: The Phillips phase of the inflation-unemployment relationship Unlock this Answer For Free Now! View this answer and more for free by performing one of the following actions Scan the QR code to install the App and get 2 free unlocks Unlock quizzes for free by uploading documents![]()
Panel (a) Panel (b) 
![]()
![]()
A) Phillips phase
Panel (a) Panel (b) ![]()

