Figure 10-7 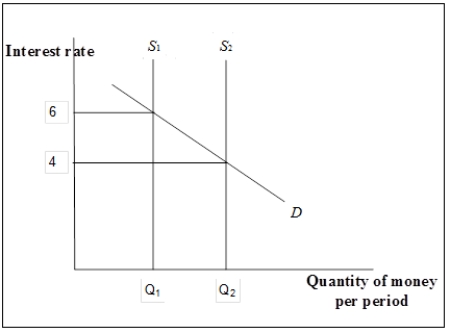
-Refer to Figure 10-7. The shift in the money supply curve from S1 to S2 is due to
A) an open market sale conducted by the Fed.
B) an open market purchase conducted by the Fed.
C) an issue of new securities by the government to finance government spending.
D) an increase in government borrowing.
Correct Answer:
Verified
Q118: Figure 10-4 Q119: Figure 10-6 Q120: Figure 10-6 Q121: Figure 10-8 Q122: Figure 10-8 Q123: A decrease in the supply of money Q124: Figure 10-8 Q126: Figure 10-8 Q126: An increase in the supply of money Q127: Figure 10-8 Unlock this Answer For Free Now! View this answer and more for free by performing one of the following actions Scan the QR code to install the App and get 2 free unlocks Unlock quizzes for free by uploading documents![]()
![]()
![]()
![]()
![]()
![]()
![]()
![]()

