Which of the quantity (Q) and price (P) combinations in the accompanying figure represents the market at competitive equilibrium? 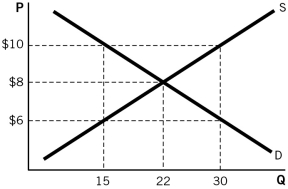
A) (15,$10)
B) (15,$6)
C) (22,$8)
D) (30,$6)
E) (30,$10)
Correct Answer:
Verified
Q26: Chuck drives past the same gas station
Q36: In March 2012,the state of California started
Q41: The demand curve for a good will
Q47: When the government places a tax on
Q51: If the price of rubber were to
Q59: Firm A notices that Firm B is
Q63: A subsidy
A) is a payment made by
Q66: Which following change in the coffee market
Q73: In 1993,the government increased the tax on
Q80: A change in quantity supplied
A) is represented
Unlock this Answer For Free Now!
View this answer and more for free by performing one of the following actions

Scan the QR code to install the App and get 2 free unlocks

Unlock quizzes for free by uploading documents